Track Record In-Depth
See more of my past predictions with PROOF.
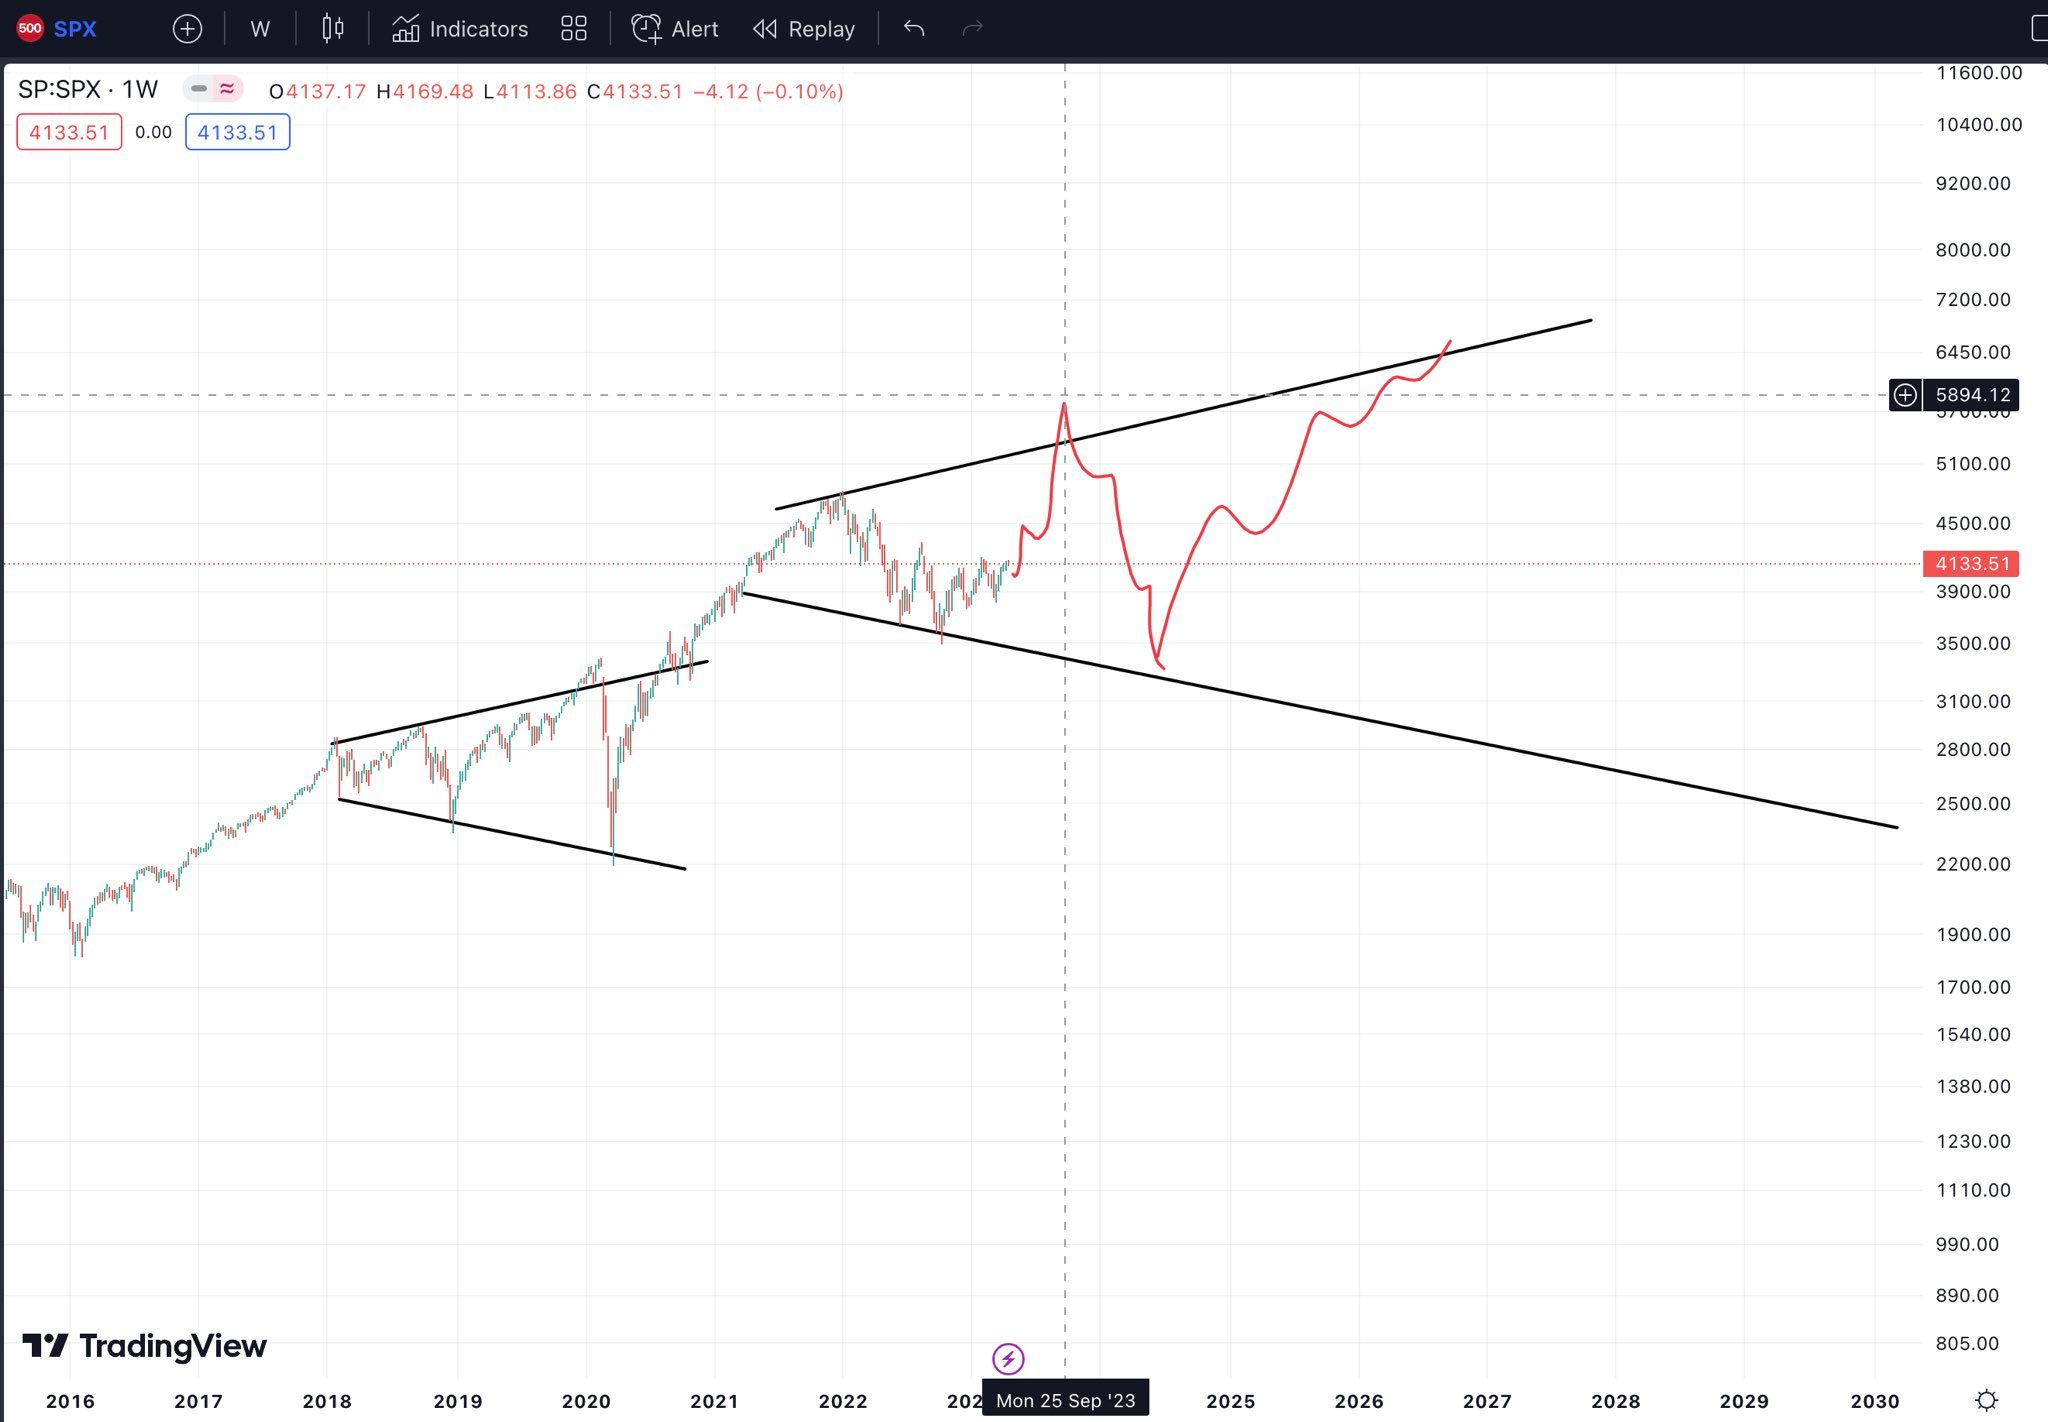
What If SPX (April 23, 2023): Broadening Wedge Ahead?
The S&P 500 (SPX) chart reveals a key setup and potential future movements:
1️⃣ Broadening Wedge Pattern:
The SPX is moving within a broadening wedge, where price swings grow wider. This signals increased market volatility and larger ups and downs.
2️⃣ Past Trends:
From 2016 to 2022, the SPX saw strong growth but hit resistance, followed by a pullback—classic market cycle behavior.
3️⃣ Future Predictions:
The red line projects a potential drop to 2,800–3,000 by 2025 before a recovery that could push the SPX to new highs by the end of the decade.
What Changed:
Patience pays. While recession fears dominated back then, history shows markets often rally into recessions. Staying invested beats timing the market.
👉 Full analysis: Tweet
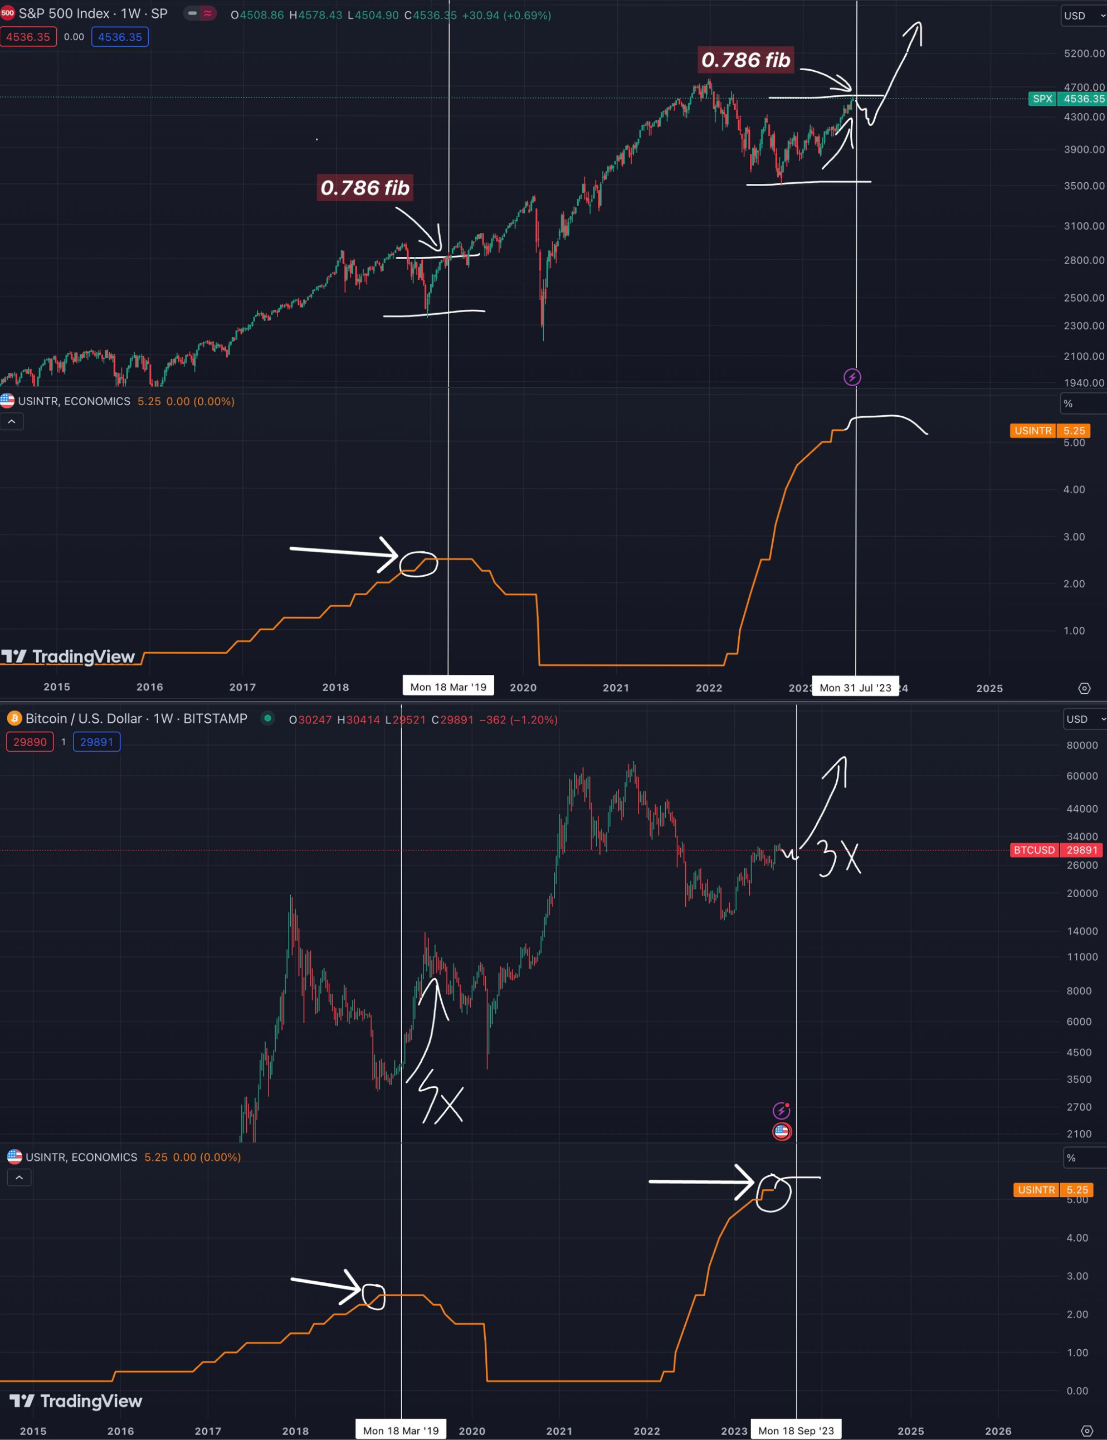
🚨 BREAKING: S&P 500 and Bitcoin at Critical Juncture!
The S&P 500 (SPX) has reached a pivotal resistance point, potentially signaling significant movements for Bitcoin:
1️⃣ S&P 500 at 0.786 Fibonacci Level:
- The SPX has ascended to the 0.786 Fibonacci retracement level, a marker often associated with potential trend reversals or continuations.
2️⃣ Bitcoin's Historical Lag Behind SPX:
- In March 2019, following the Federal Reserve's final rate hike, the SPX touched the 0.786 Fibonacci level. Bitcoin, however, remained in a low range for several months before experiencing a significant surge.
3️⃣ Current Market Dynamics:
- As of July 2023, the SPX is again testing the 0.786 Fibonacci level. Meanwhile, Bitcoin is grappling with resistance around the $31,000–$32,000 range, mirroring the 2019 pattern where it lagged behind the SPX by approximately three months.
This alignment suggests that Bitcoin may be poised for a notable move, contingent on the SPX's performance at this critical juncture.
👉 For a detailed analysis, see this Tweet.
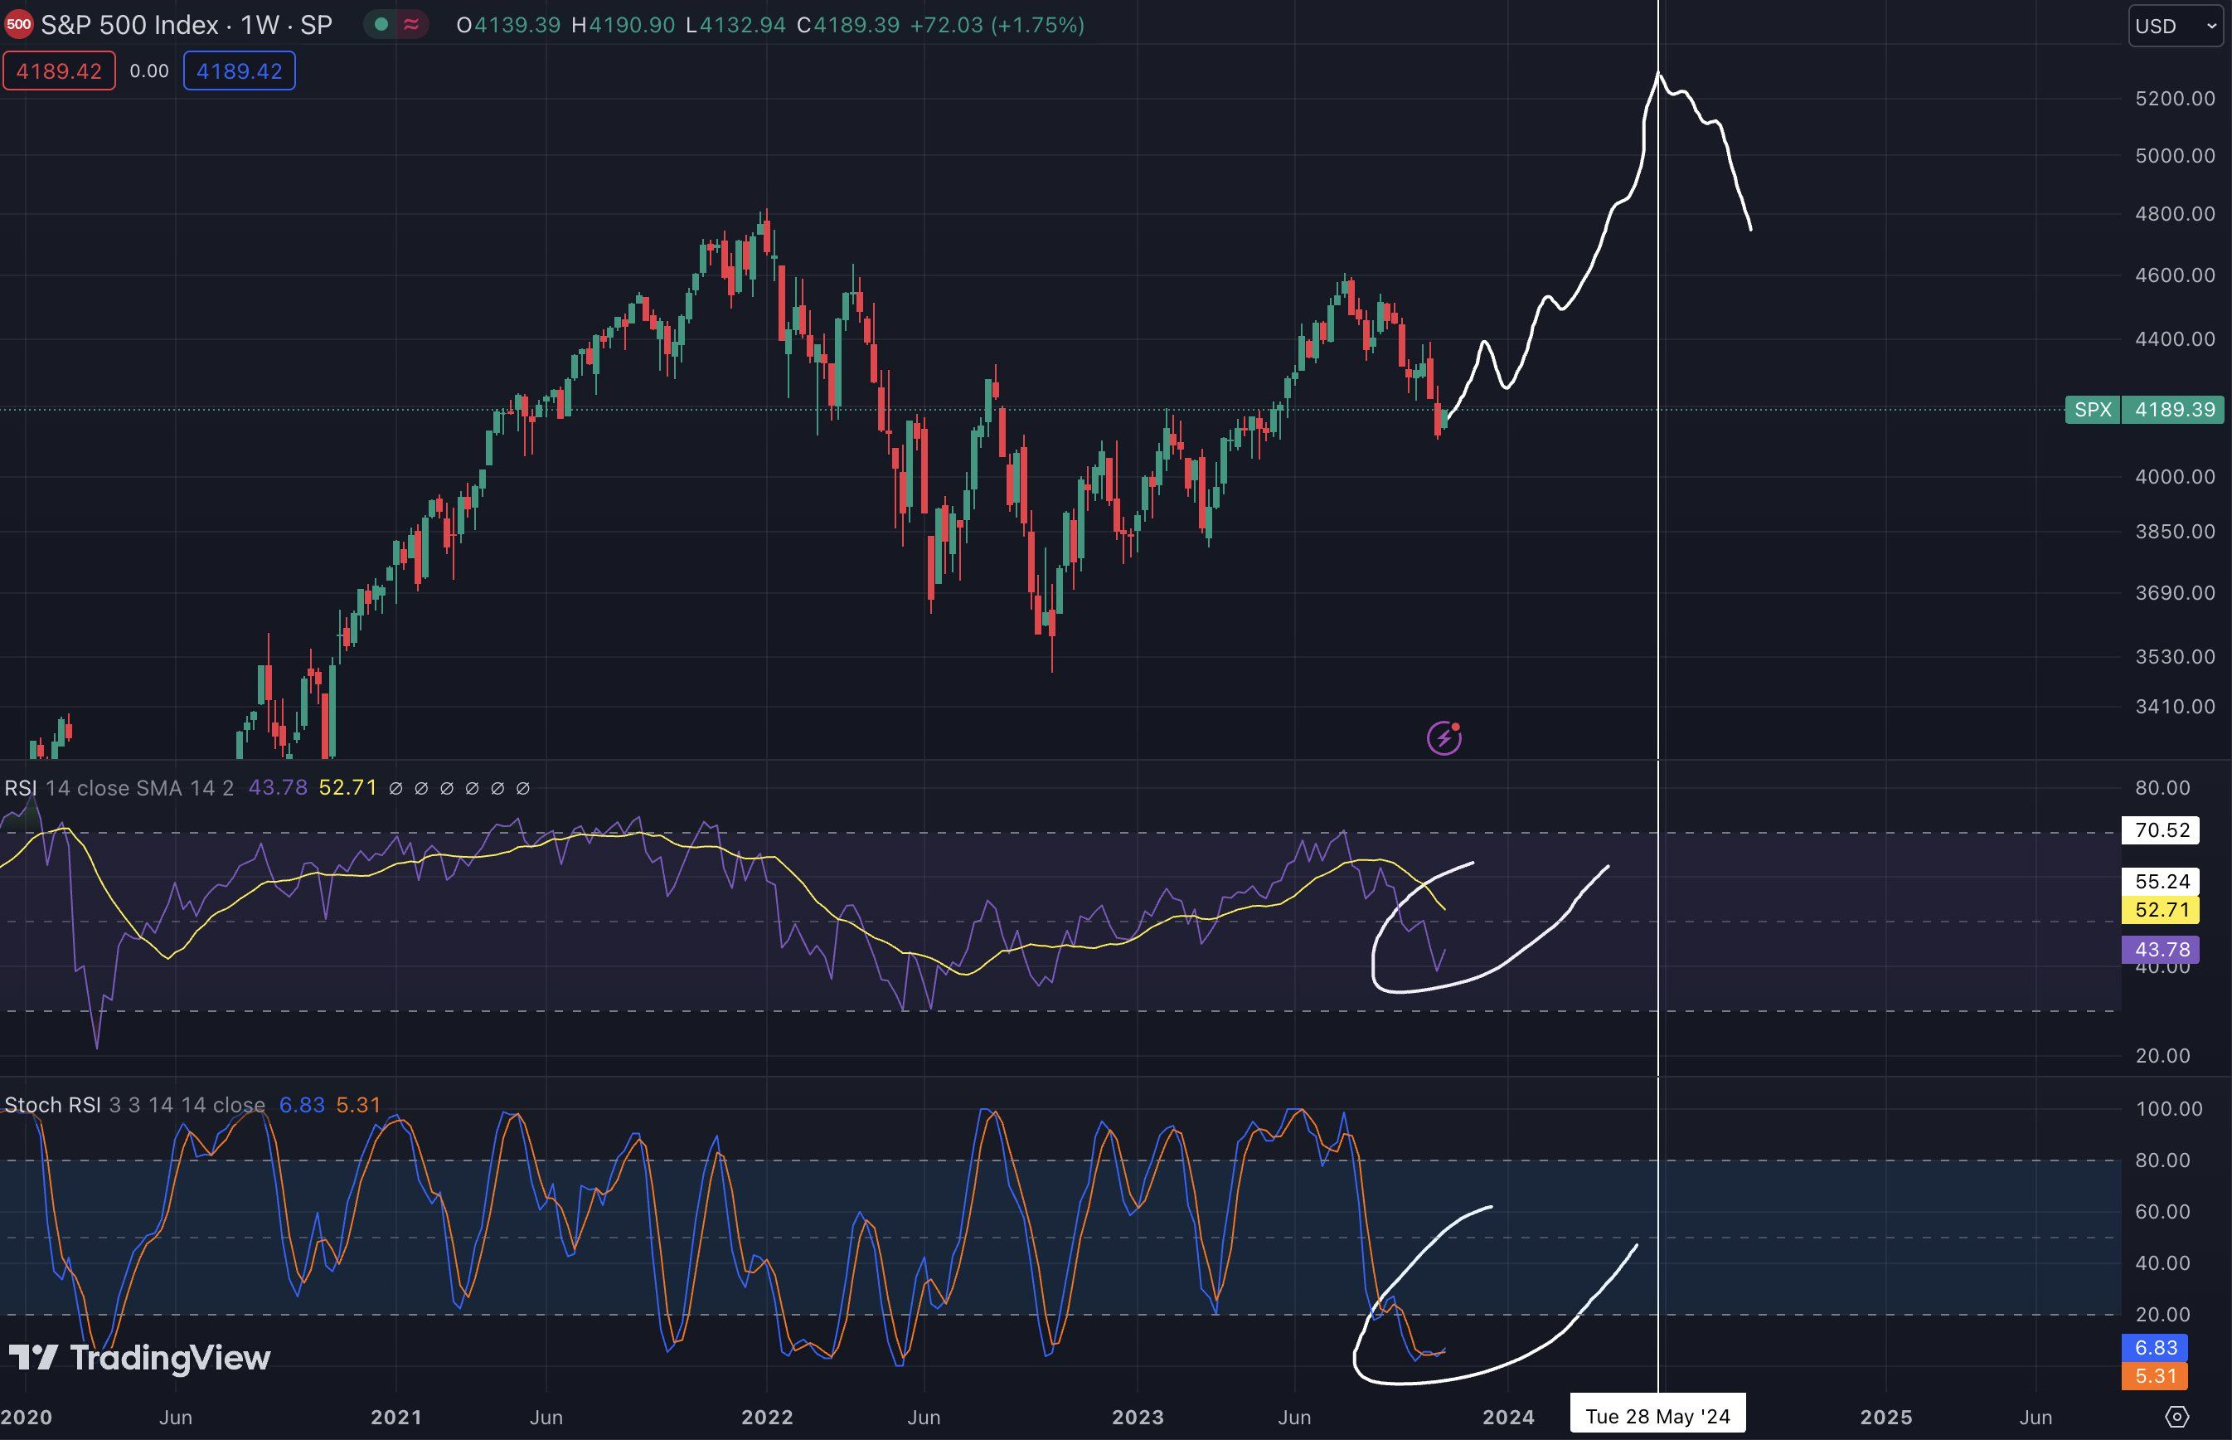
How I Predicted the S&P 500’s Rally 🚀
Earlier this year, I made a bold call based on technical indicators, and here’s how it unfolded:
1️⃣ Spotting a Rally in Mid-2023:
I noticed the S&P 500 was primed for a surge. The RSI sat neutral at 52.71, and the Stochastic RSI was deeply oversold at 5.31—classic signs of a market ready to rebound.
2️⃣ Indicators Confirmed a Bullish Run:
The RSI recovery signaled increasing buying momentum, while the oversold Stochastic RSI strongly pointed to an upward move.
3️⃣ Cautioned About a Pullback:
While I expected the rally, I also warned of a correction after new highs—likely heading into 2024. I advised investors to stay alert for reversal signs.
And just as predicted, the S&P 500 rallied, fueled by the exact factors I highlighted!
👉 See the full analysis: Tweet
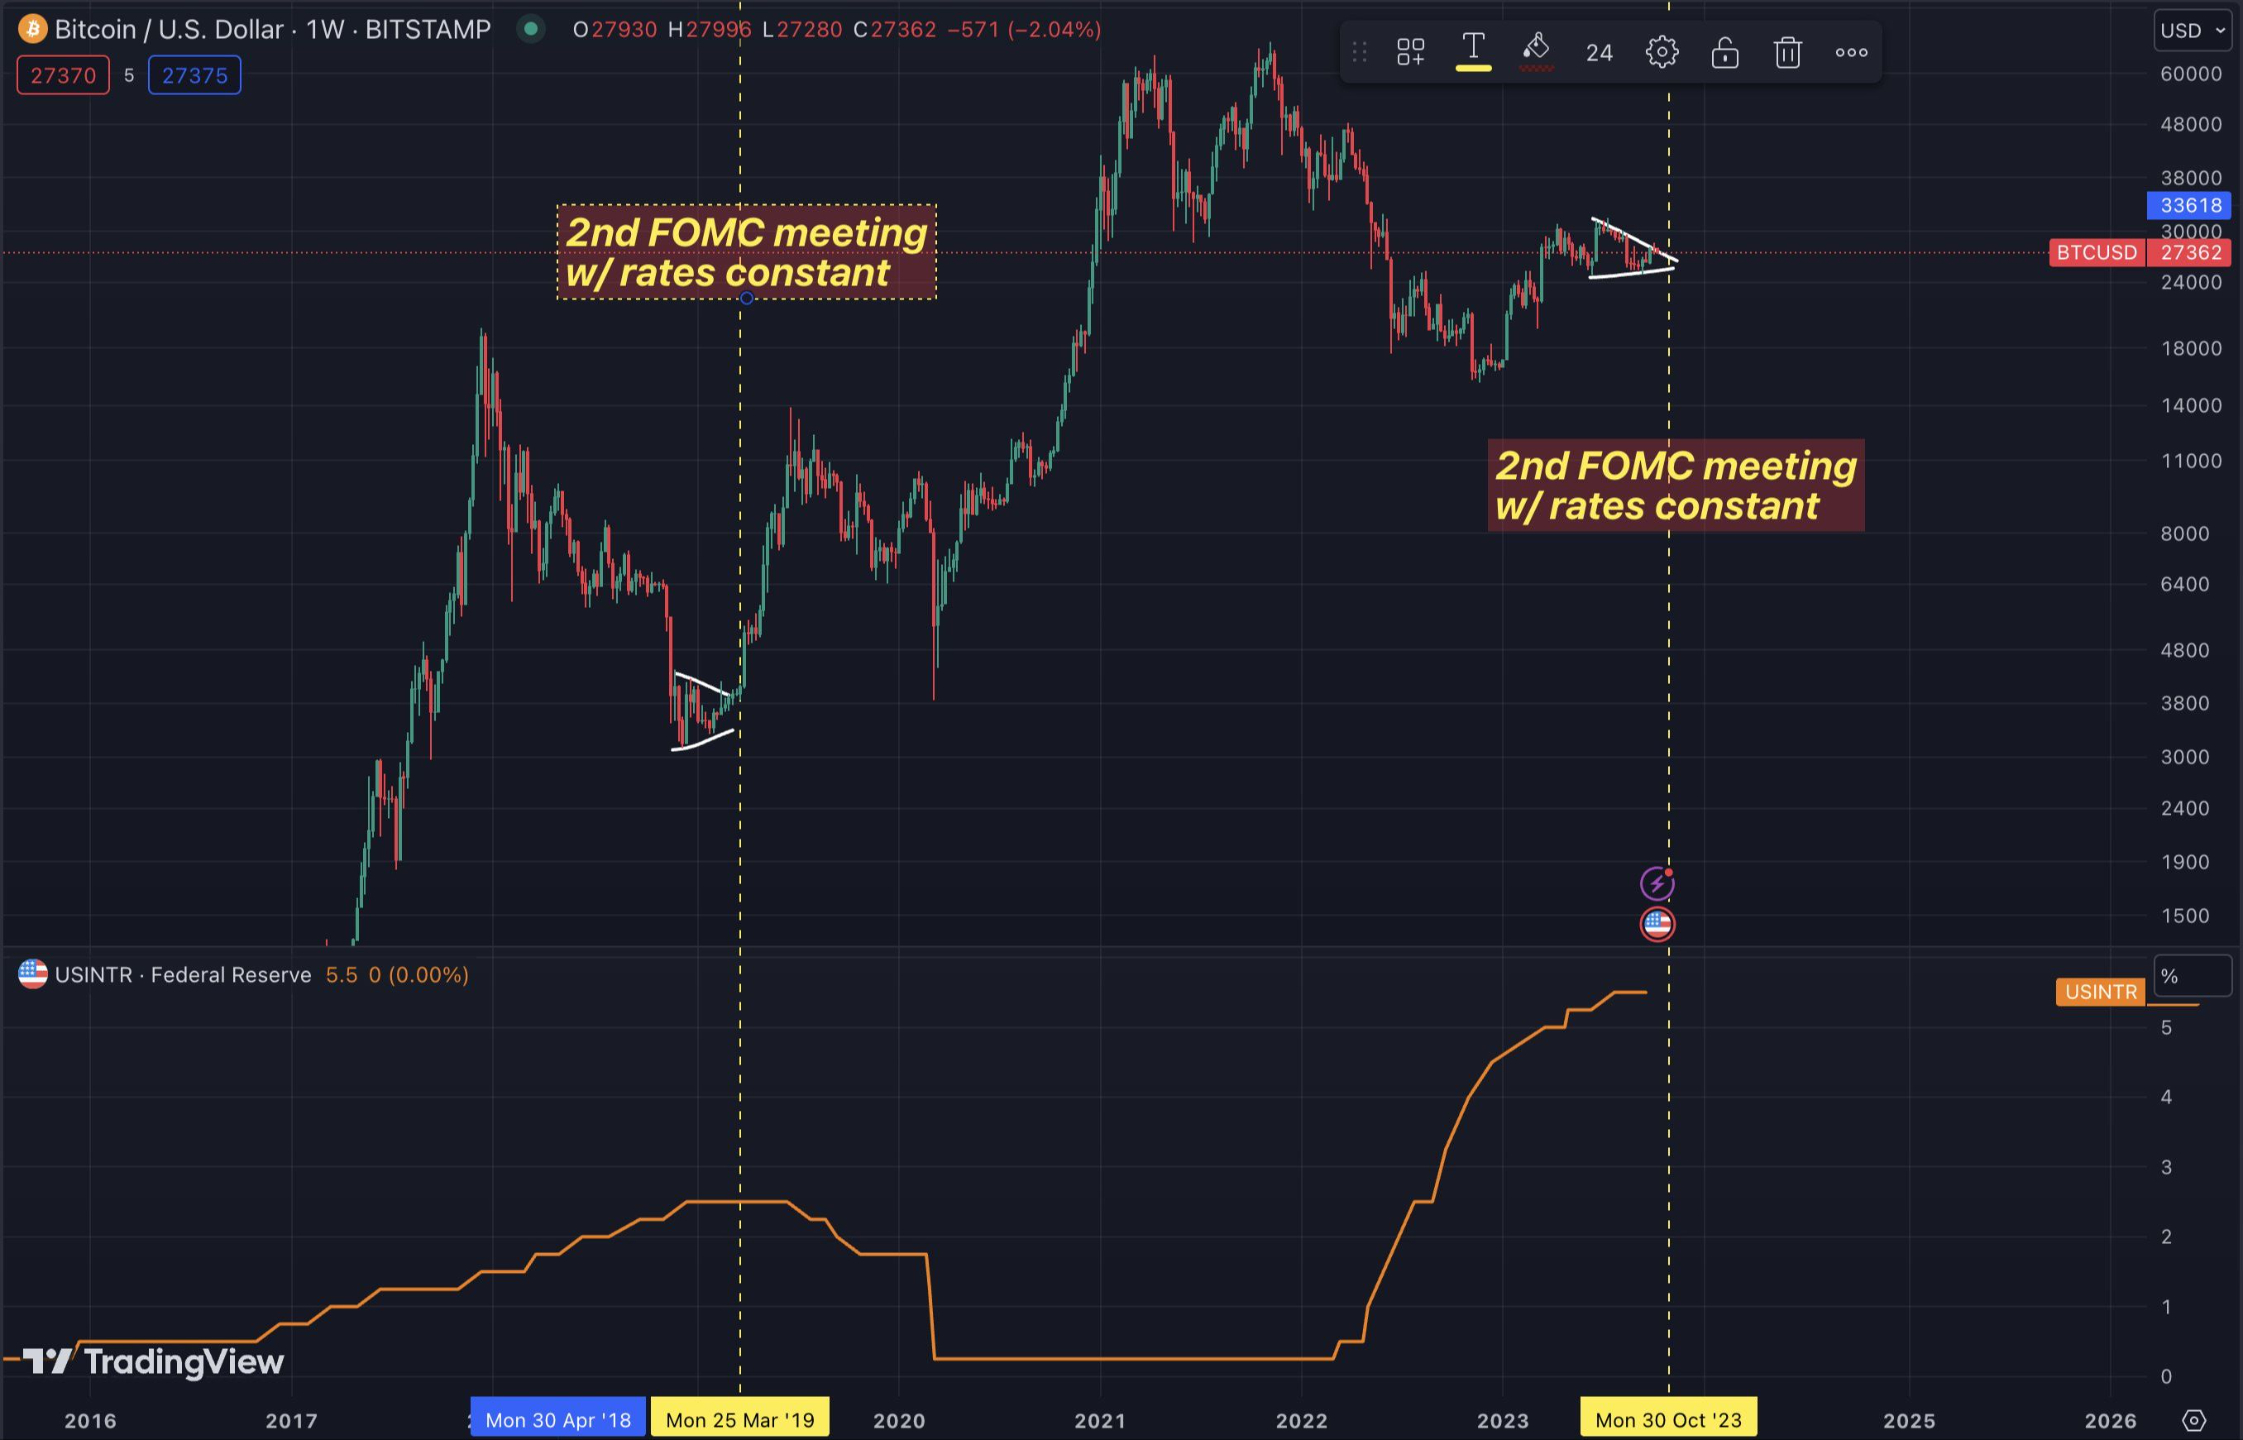
The Moment I’ve Been Waiting For 🚀
Here’s how my 2023 Bitcoin prediction unfolded:
1️⃣ Key FOMC Meetings Set the Stage:
In 2019, I observed that after the second Federal Open Market Committee (FOMC) meeting where rates stayed constant, Bitcoin began a powerful uptrend. I predicted the same would happen in 2023.
2️⃣ Triangular Consolidation Hinted at a Breakout:
Before the second FOMC meeting in 2023, Bitcoin was consolidating in a triangular pattern. Based on the 2019 precedent, I anticipated this setup would lead to a significant breakout.
3️⃣ The Rally I Predicted:
I advised that if the FOMC held rates steady—just like in 2019—Bitcoin would follow with a strong rally. The charts were aligning for a move reminiscent of Bitcoin's explosive 2019 growth.
👉 See my full analysis: Tweet
Now for more degenerate plays:
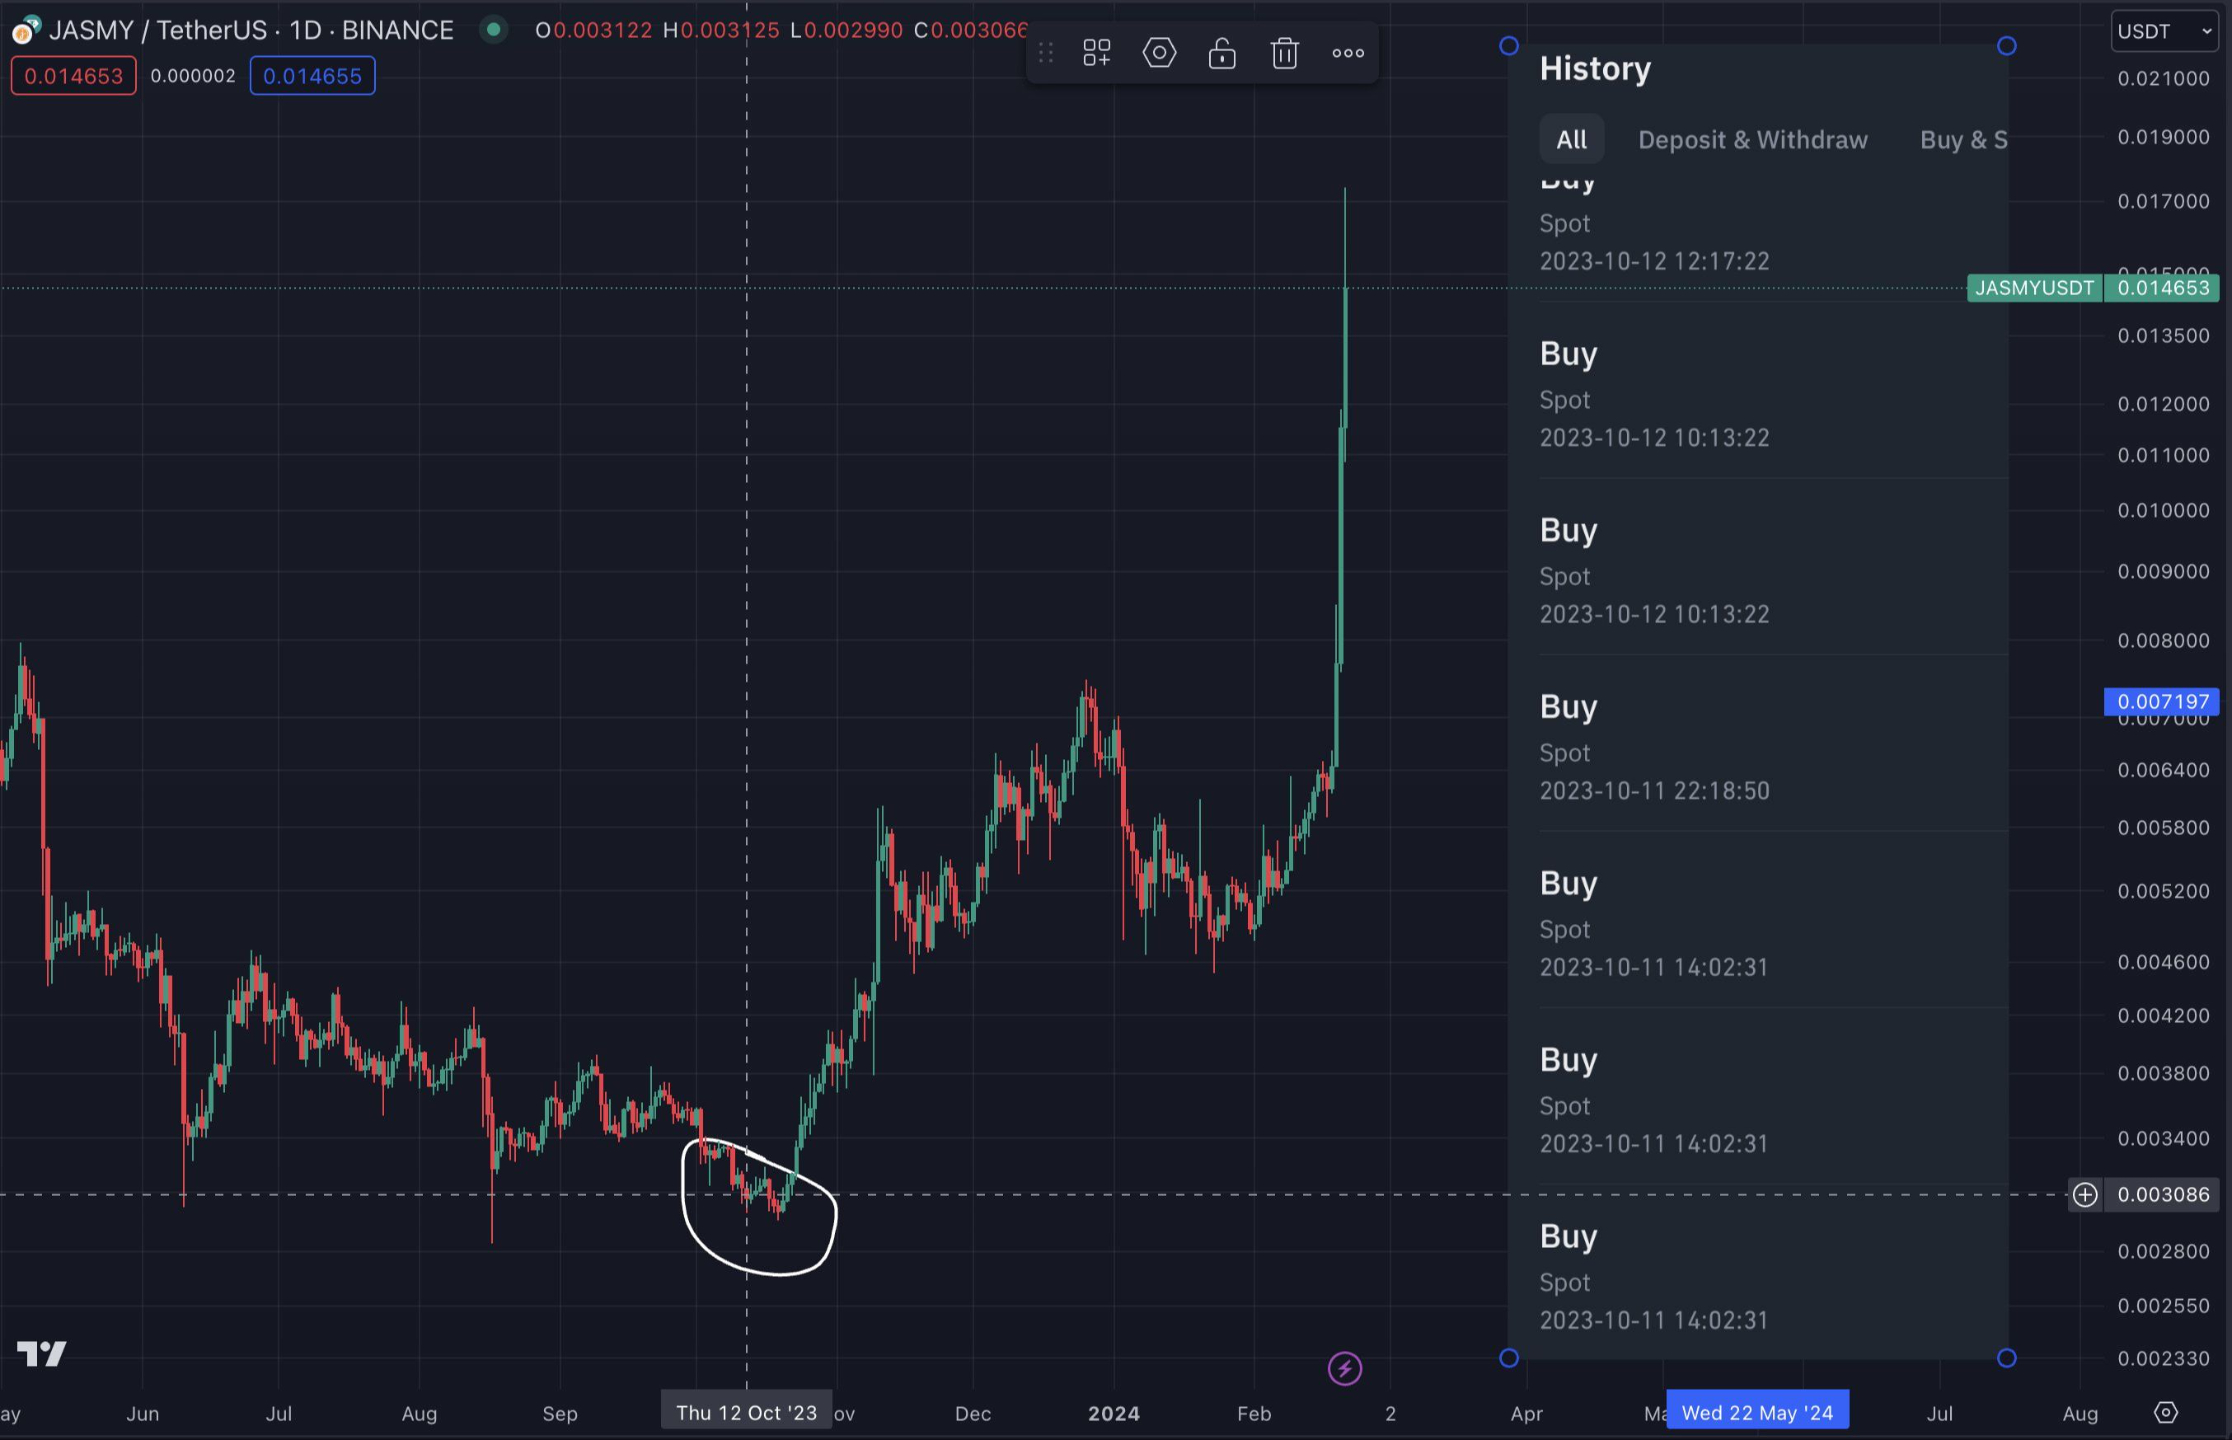
A Bold Move: Trusting the Charts 🚀
Sometimes, the best opportunities are hidden in plain sight—here’s how I found one others missed:
1️⃣ Spotting Opportunity:
I noticed the JASMY/USDT chart when the price was at its lowest. The market was quiet, but the setup was too good to ignore.
2️⃣ Trusting the Technicals:
Without overthinking the fundamentals, I trusted the chart. The price action clearly signaled a reversal, and I acted on it.
3️⃣ The Outcome:
My entry, circled at the bottom, was perfect. The chart exploded upward, proving that trusting technical analysis can lead to big wins.
Why This Matters:
This wasn’t luck—it was about recognizing and acting on potential. While others ignored the opportunity, I trusted my analysis and succeeded.
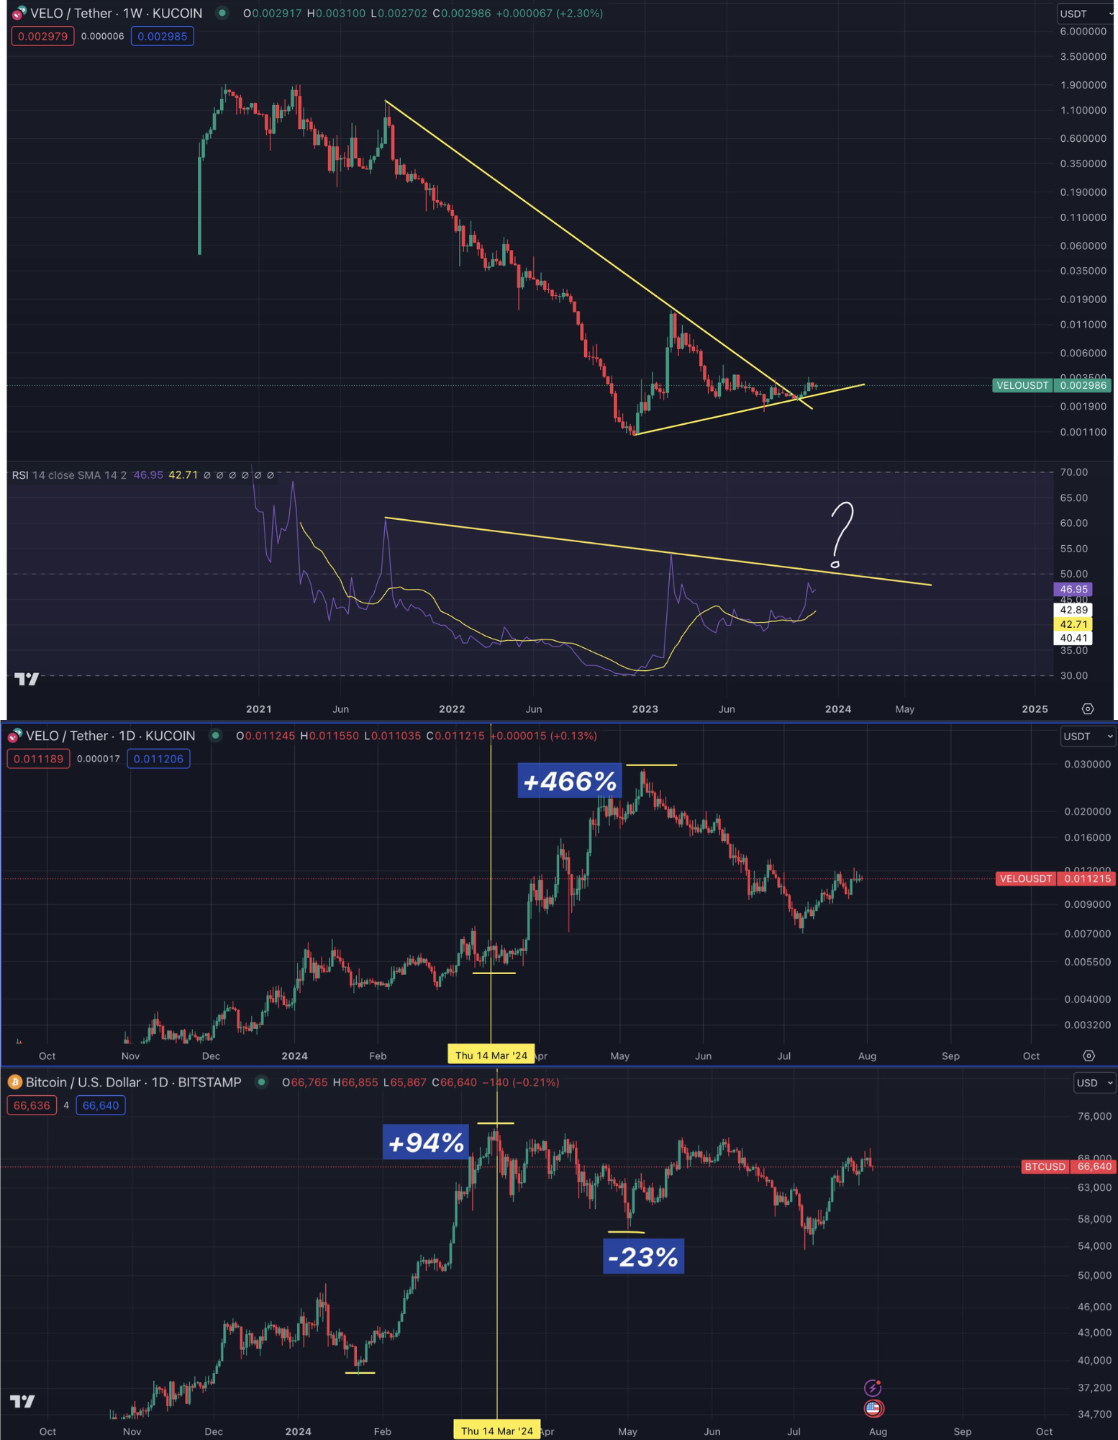
Remember How Rotation Works in the Magical Land of Crypto
In the world of crypto, market rotations are a powerful phenomenon. The charts of VELO/USDT and Bitcoin (BTC/USD) offer a perfect illustration of how this rotation can play out.
First Chart (VELO/USDT):
- Technical Formation: VELO has been consolidating within a descending triangle pattern for an extended period, showing a long-term downtrend. The RSI has been gradually climbing, hinting at a potential breakout.
- Possible Breakout: The tight consolidation suggests that VELO might be gearing up for a significant move. If it breaks above the resistance, a strong rally could follow, similar to what we’ve seen in previous market cycles.
Second Chart (VELO vs. Bitcoin):
- Historical Rotation: The comparison between VELO and Bitcoin shows a classic rotation. In March 2024, VELO surged by an astonishing +466% while Bitcoin increased by +94%. However, as the market rotated, Bitcoin faced a -23% decline, while VELO maintained its gains.
- Understanding Rotation: This is a reminder of how capital flows within the crypto market. While Bitcoin often leads, altcoins like VELO can experience explosive gains once Bitcoin’s momentum starts to slow. The key is to recognize when the rotation begins and position accordingly.
Here's The Tweet: https://x.com/chifoicristian/status/1818176563856216470?s=46&t=n1VGiEO2NZQS0CwcNwdGBg
Would You Not Short This? 🤔
If this chart wasn’t inverted, it’d be a perfect short setup.
The Setup:
- Fibonacci Resistance: Price stalls near the 0.236 level, where rallies often reverse.
- Bearish Momentum: Multiple rejections signal buyers losing strength, with a projected drop.
- Textbook Short: Stalling at resistance and bearish signals point to a sharp move down.
This setup highlights why watching key levels and momentum shifts is crucial.
👉 Full analysis: Tweet

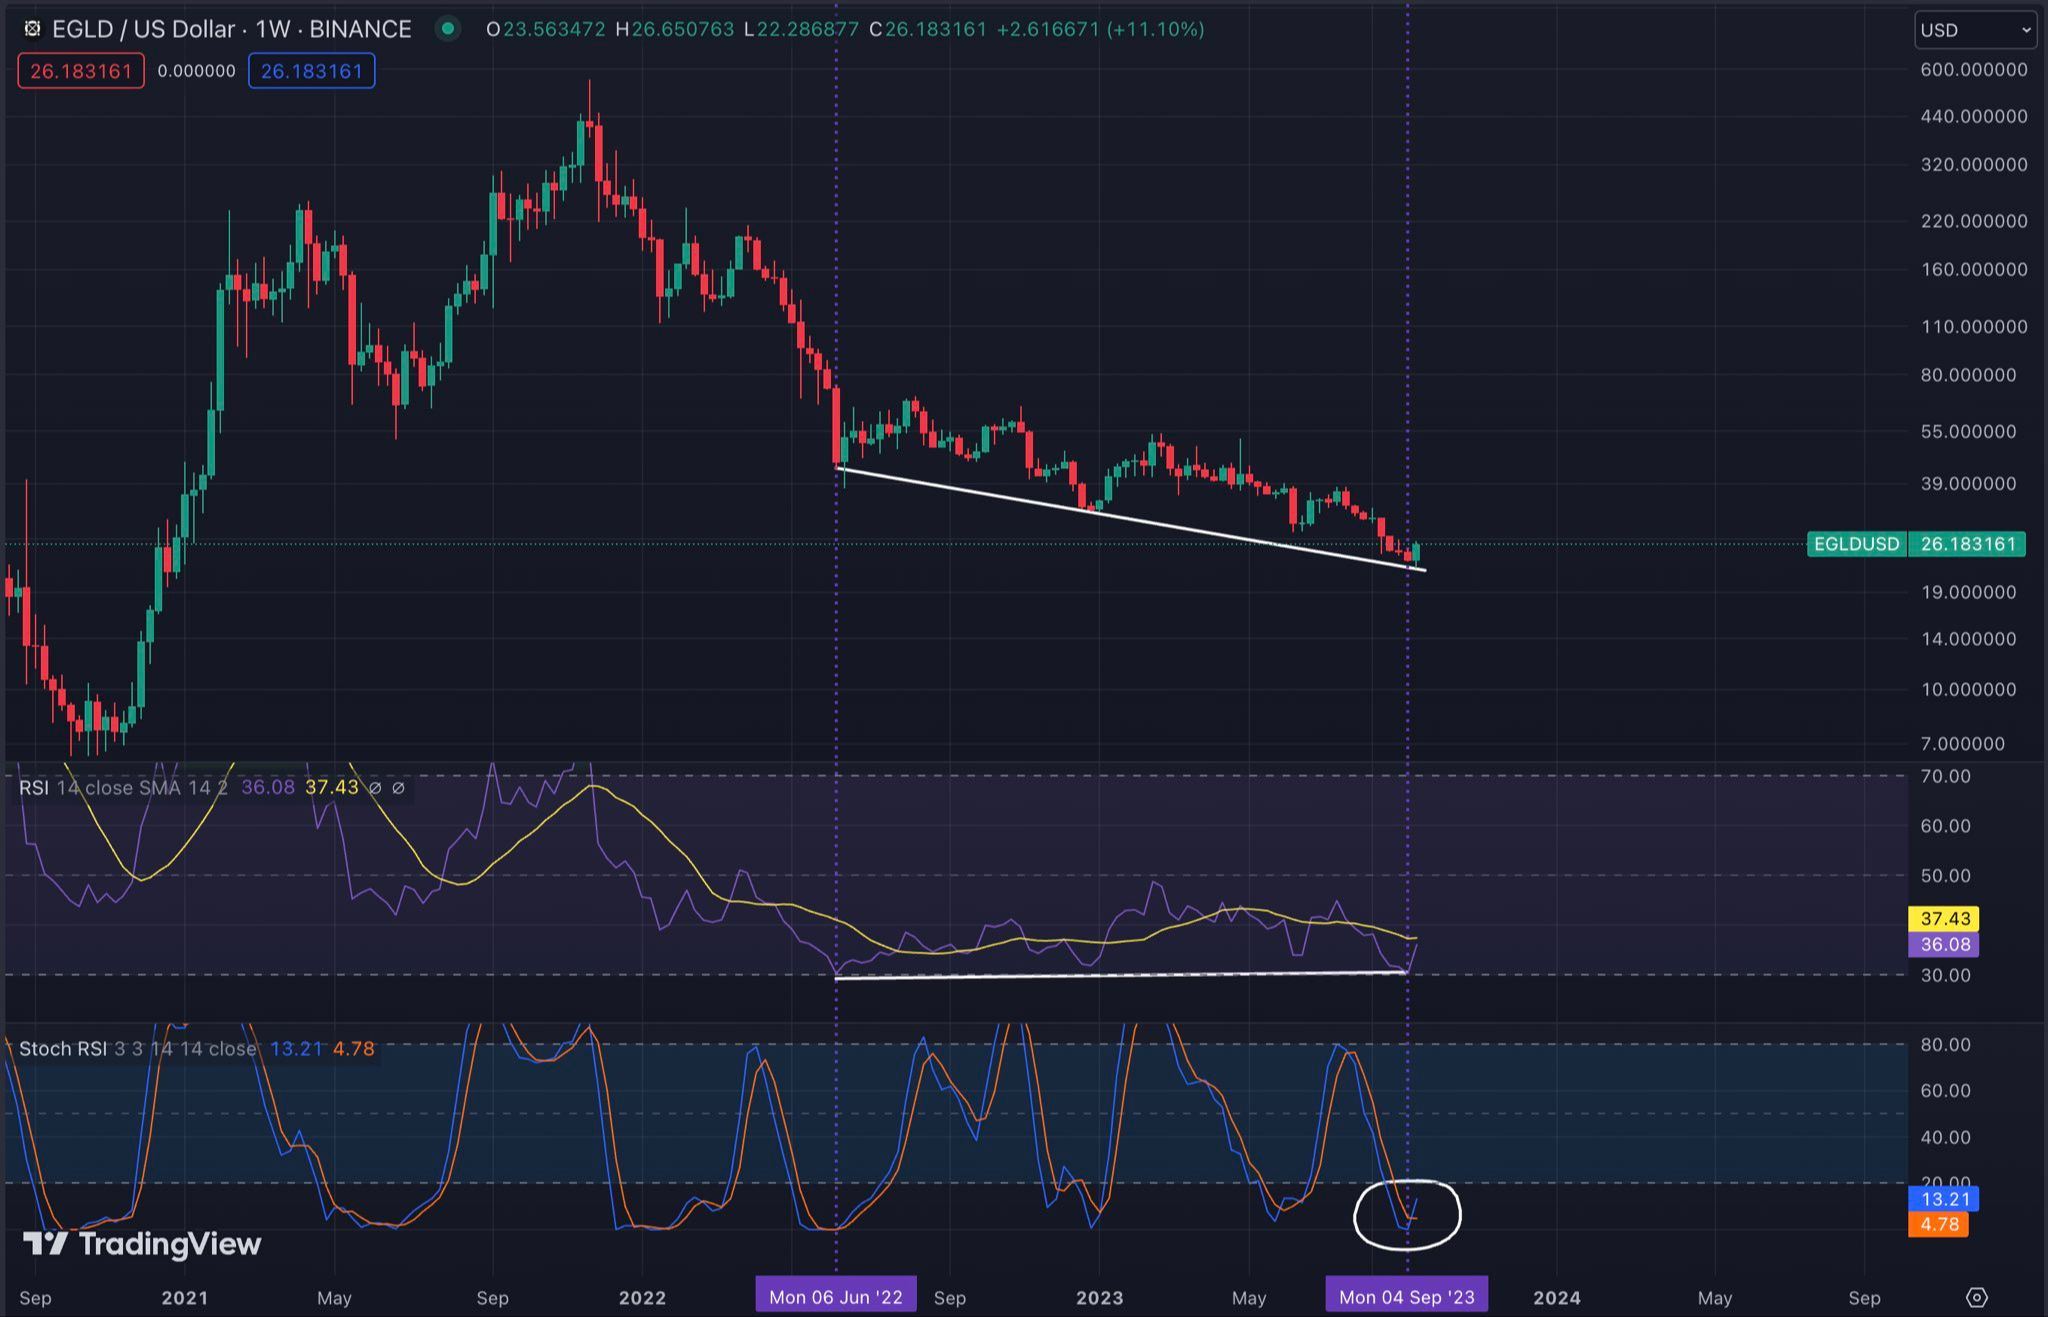
$EGLD: The Easiest 5x Spot Long 🚀
The chart for $EGLD is shaping up for a massive breakout—here’s why I believe this is my easiest 5x spot long:
1️⃣ Descending Wedge Pattern:
$EGLD is trading at the bottom of a descending wedge, a bullish reversal setup where breakouts typically start.
2️⃣ Bullish RSI Divergence:
While price makes lower lows, the RSI is steady, signaling weakening downward momentum—often a sign of an upcoming rally.
3️⃣ Oversold Stochastic RSI:
The Stochastic RSI is deeply oversold but just turned upward, a classic signal that a reversal is imminent.
Why This Matters:
The combination of these signals—a bullish wedge, RSI divergence, and oversold Stochastic RSI—makes this a high-probability breakout setup.
👉 Full analysis: Tweet